
Bitcoin dipped on its charts in the last 24 hours. The king coin was changing hands for $41,521 at press time.
MANA and DOT had briefly depreciated but have renewed their northbound price action in the past trading sessions. Near term, technicals are yet to turn fully bullish.
MANA Price Analysis: MANA/USDT Four Hour Chart

Decentraland was trading for $3.10 at press time. The coin had struggled a couple of times to move over the $3 mark. Overhead resistance stood for the coin at $3.28 and then at $3.49.
MANA mostly traded conservatively within a range of $3.01 and $3.49 for the last couple of weeks. The token had seen quite a surge when it hit an all-time high on December 27. The outlook indicated that the bulls might have tried to resurface.
The Relative Strength Index had indicated over a couple of days that buying strength has taken a hit, however, RSI had recovered but noted a downtick again.
The Directional Movement Index displayed a negative crossover, with the -DI parked over the +DI. Most importantly, ADX displayed a weakening of the price trend which means prices would appreciate typically over the next trading sessions.
The Awesome Oscillator portrayed small red histograms in accordance with a minor pullback in prices.
Polkadot Price Analysis: DOT/USD Four Hour Chart
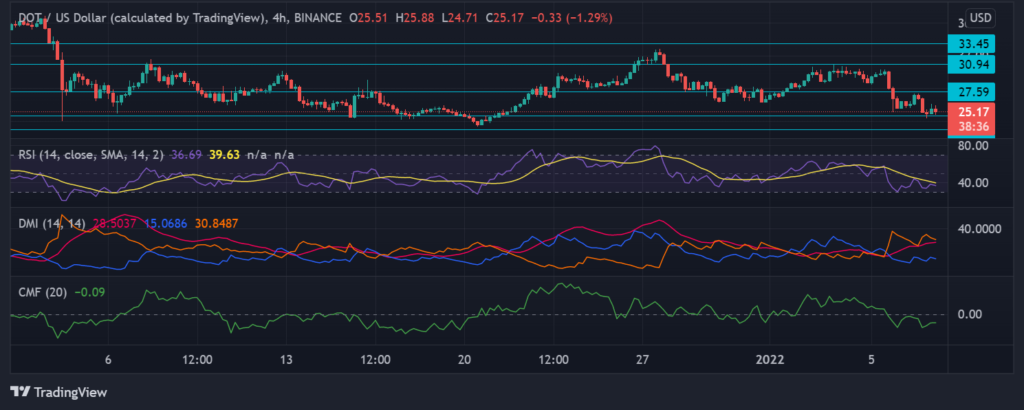
Polkadot was priced at $25.17 after the coin moved southwards ever since January 5. The coin, however, recuperated slightly and could attempt to trade near the resistance mark of $27.59.
From the technicals, it’s evident that the coin was still in recovery post its short-term price correction. The trading range remained between $24.07 and $30.94. The coin’s attempt to break past the $27.59 barrier was rejected and shortly after the coin had lost its value.
The Relative Strength Index was below the half-line as sellers have increased in the market. The same reading is reflected in the capital inflows of the asset, as the Chaikin Money Flow depicted a fall in inflows with the indicator beneath the half-line.
Directional Movement Index was negative along with ADX pointing towards a bearish price run. In an event of prices falling, the coin would trade near the $24 mark.